
The Imixs-Workflow engine has a build-in metric service which is based on lates vdrsion of Eclipse Microprofile 3.2. This metric service can be used to monitor the Imixs-Workflow engine and its running processes. The Imixs Metric Service provides fine-grained metrics to monitor individual business processes or even individual process steps within a specific workflow.
The Data format is based on the common Prometheus format and can be analyzed in real-time with different kind of Tools.
Howto Setup
To setup the imixs-metrics you just need to enable the metric service by a environment variable:
METRICS_ENABLED: "true"
The Imixs-Workflow engine will start automatically collecting all relevant metrics during document updates or the processing life-cycle of a custom business process.
The Metrics are available on the metrics api endpoint of the application server. For Wildfly this endpoint is for example:
http://localhost:9990/metrics
Next you can start a Prometheus Server to collect the metrics by using the following prometheus.yml file:
global:
  scrape_interval:     15s # By default, scrape targets every 15 seconds.

  # Attach these labels to any time series or alerts when communicating with
  # external systems (federation, remote storage, Alertmanager).
  external_labels:
    monitor: 'imixs-monitor'

  # Imixs-Microservice - payara metrics
  - job_name: 'imixs'
    scrape_interval: 5s
    metrics_path: /metrics
    static_configs:
      - targets: ['imixs-workflow:8080']

  # Imixs-Microservice - wildfyl metrics
  #- job_name: 'imixs'
  #  scrape_interval: 5s
  #  metrics_path: /metrics
  #  static_configs:
  #    - targets: ['imixs-workflow:9990']
Note: that for wildfly the metrics_path and target port differs from the payara config!
This will collect metrics from the service endpoint ‘http://imixs-workflow:8080/’. Prometheus will scrape the metrics every 15 seconds and stores the result into its own database.
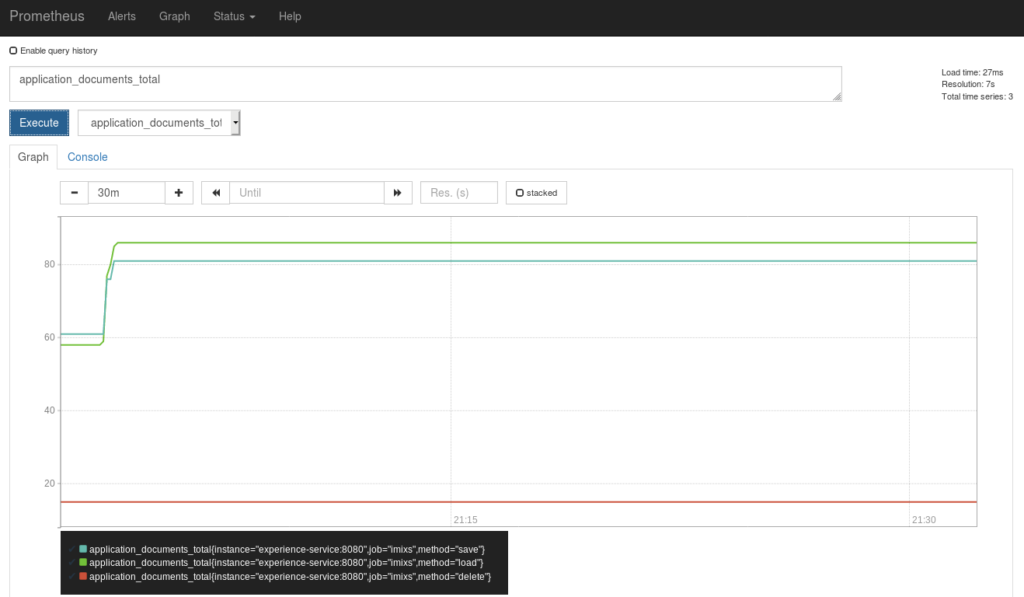
From the Prometheus Dashboard you can test the data within your web browser:
Monitoring Metrics with Grafana
To monitor you workflow you can easily connect your Prometheus server with a Grafana Instance. This allows you to visualize your metrics in an individual and more detailed dashboard.
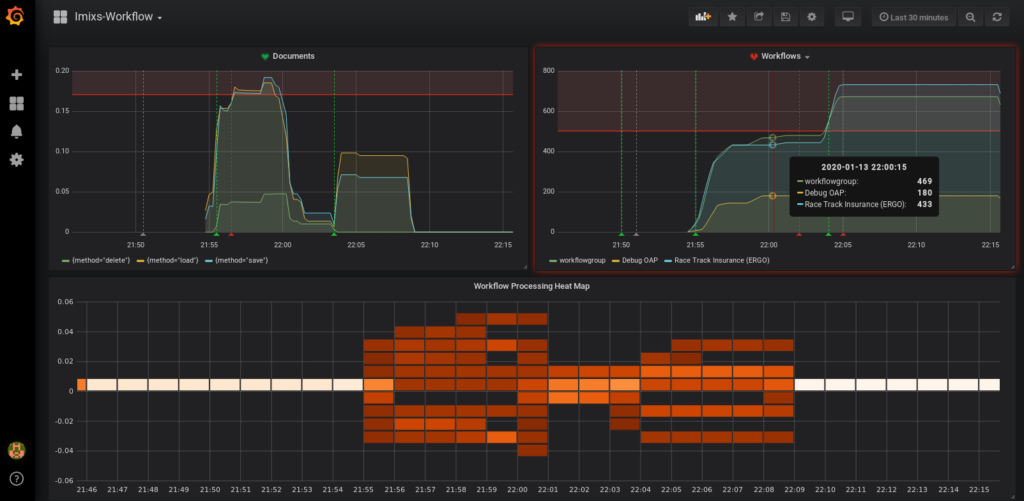
There are a huge amount of functions available in Grafana to analyze and monitor data. You can also activate individual alerts to notify your process owner about the load of your business processes.