Enterprise workflow automation rarely lives in isolation. Every business process needs to talk to external systems. With Imixs-Connect we provide a new workflow integration layer to define stable contracts between different IT systems.
The Problem with Traditional Integration Approaches
The classic answer is to build a dedicated client inside the workflow engine. You write the code, you manage the API keys, you handle the error cases — and suddenly you own the integration. When the ERP changes its API, when the CRM goes down, when the data doesn’t synchronize correctly — the workflow team gets the call. But this is not a technical problem. It is an architectural one.
Building system-specific clients inside a workflow engine moves responsibility in the wrong direction. The team that knows the external system best — the ERP developer, the CRM administrator, the integration specialist — is not involved. The workflow team, which knows the process best, ends up owning business logic that belongs elsewhere.
Security warnings have always been part of the software landscape. But something has shifted recently. The latest wave of reports is different – and it is not just the usual noise. The Threat is Real – “The question is no longer whether your application will be attacked. The question is whether your data is still safe after the attack succeeds.”
AI-assisted attacks are changing the rules of the game. Where a human attacker once needed hours or days to analyze application code, identify vulnerabilities, and craft an exploit, an AI-powered tool can do the same in minutes. Automated reconnaissance, pattern-based vulnerability detection, intelligent fuzzing – what used to require deep expertise is becoming increasingly accessible.
With the latest version of Imixs-AI we just shipped a new feature extending BPMN with AI: Tool Calling support for the OpenAI API. This is a powerfull new feature introducing a fundamental shift in what an LLM can do inside a workflow application.
From answering questions to starting business processes
Until now, an LLM integrated into Imixs could analyze data, generate text, evaluate conditions, and assist users with information. All of that is great. But the LLM was always just talking. It could tell you “you should start a vacation request” — but it couldn’t actually do it. Tool Calling changes this completely.
With Tool Calling, the LLM no longer just responds with text. It can respond with a structured request to execute a function in your application. Consider this scenario:
A user types into the workflow application:
"I need next week off."
Imixs-AI now doesn’t explain how to submit a vacation request. It doesn’t ask for clarification. It fires a tool call:
Now a business application based on Imixs-AI is able to handle this respons and start the correct BPMN process — all from a single natural language sentence. No menus, no navigation, no searching. Just say what you want and it happens.
Theia IDE is a modern, AI-native IDE which can be run on Desktop as also in a Docker container as a Web app. With the Docker image you can deploy Theia IDE in a Kubernetes cluster. The deployment is straightforward — until you try to use extensions that open embedded browser windows. This post explains the problem and how to solve it using wildcard certificates with DNS-01 challenges.
If you work on modern enterprise IT systems, “AI Agents” are the new elephant in the room. Every day, new YouTube videos appear where someone talks enthusiastically about AI Agents and Agentic AI. The base line – software systems not using AI Agents are outdated and behind the times. But what does it really mean to integrate an AI agent into critical business applications?
Imixs-Workflow is an open-source project for building transactional, secure, and transparent business applications based on the BPMN 2.0 modeling standard. The idea is simple: you describe a business process in a model, then use a workflow engine to execute that model. The concept of a workflow engine is not new, but it remains a well-grounded approach to executing predefined business processes in a transparent, comprehensible, and transactional context. This simply means that the workflow engine guarantees a task is carried out exactly as previously defined. Execution can be performed by both IT systems and humans.
Let’s have a look how this concept is related to AI Agents.
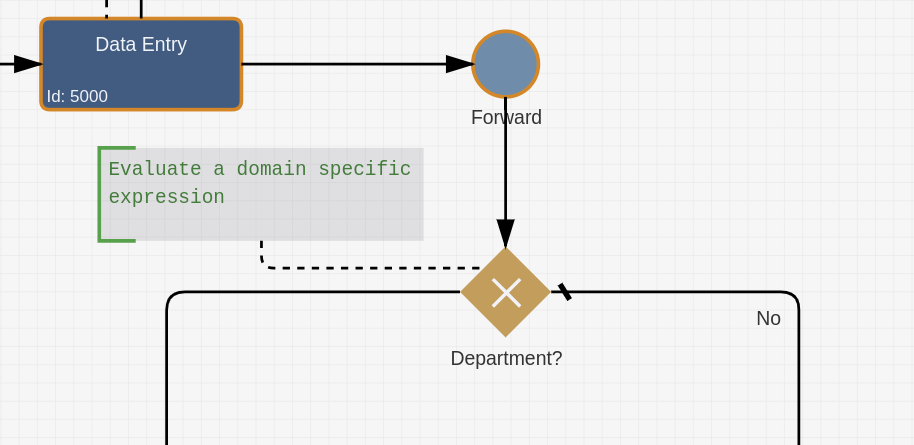
With our latest version of Imixs Workflow, we introduce a game-changing approach to business process automation, enabling domain-specific handling of BPMN 2.0 conditions.
The Challenge
In previous versions, conditional sequence flows in the Imixs Workflow engine —as in most traditional BPMN engines — could only be defined using script functions. While this scripting-based approach offered flexibility, it also introduced several limitations:
Domain-specific languages could not be supported
Conditions were tightly coupled to technical implementation
Adding new evaluation logic required modifying or extending engine code
Complex business rules were difficult to express and maintain
These constraints made it challenging to adapt and extend business logic across different domains.
The Solution: CDI Event-Driven Condition Evaluation
Imixs Workflow now introduces a revolutionary and extensible architecture for condition evaluation. Leveraging Jakarta EE’s CDI (Contexts and Dependency Injection) events, conditions can be transformed and interpreted by specialized observers before evaluation — all without modifying the core engine.
This new approach not only supports functional scripting, but also enables fully domain-specific evaluation of BPMN 2.0 conditions, such as SQL-based queries, external API calls, or even AI-driven logic.
How It Works
When a sequence flow condition is encountered, the system fires a CDI event that any registered observer can intercept and handle. Observers can:
Translate domain-specific languages into executable code
Implement business rule languages tailored to specific domains
Add validation, monitoring, and auditing layers
Integrate external services and rule engines
Real-World Example: Domain-Specific Conditions
Instead of writing complex JavaScript like this :
// Before: Hard-coded and difficult to maintain
!['AT', 'BE', 'BG', 'HR', ...].includes(workitem.getItemValueString('country'))
You can now define business rules in a domain-specific language:
SQL: SELECT COUNT(*) FROM eu_countries WHERE country_code = ? > 0
A specialized domain observer intercepts this rule and translates it into the appropriate JavaScript. The beauty? The RuleEngine doesn’t need to know anything about domain-specific languages — it simply evaluates the resulting JavaScript as it always has.
Implementation Example
The new event-driven design of Imixs Workflow is built on Jakarta EE’s CDI (Contexts and Dependency Injection) event mechanism — a core implementation of the Observer Pattern. This means that custom components can observe and react to condition evaluation events without depending on the workflow engine itself.
Creating your own domain-specific observer is straightforward. Simply extend the new ConditionalExpressionEvent class and implement your logic as a CDI observer method:
@ApplicationScoped
public class DepartmentSQLRule {

    public void onConditionEvaluation(@Observes ConditionalExpressionEvent event) {
        String condition = event.getCondition();

        if (condition.startsWith("SELECT ")) {
            // Transform domain-specific rule into JavaScript
            String javascript = translateSQLRule(condition, event.getWorkitem());
            event.setCondition(javascript);
        }
    }
}
In this example, the observer listens for every ConditionalExpressionEvent. If the condition starts with an SQL statement, it automatically transforms the domain-specific rule into executable JavaScript. Because this is handled entirely via CDI events, the core RuleEngine remains untouched — ensuring maximum flexibility and extensibility.
Opening Doors for Enterprise Development
This new observer-based architecture fundamentally changes how enterprise workflow systems are developed and evolved. By decoupling condition evaluation from the core engine, organizations gain unprecedented flexibility in how business rules are expressed, validated, and executed. Teams can now create tailored domain-specific languages that speak the language of their business domain—whether that’s banking regulations, insurance underwriting, supply chain logistics, or healthcare compliance.
The plugin-based approach means that new capabilities can be added without touching the workflow engine itself. Observers can be developed independently, tested in isolation, and deployed without impacting existing systems. This enables enterprises to build sophisticated, multi-layered workflow systems where each layer serves a specific purpose: one observer might handle compliance validation, another translates business rules into executable code, a third provides audit logging—all working seamlessly together.
The possibilities are as diverse as the challenges enterprises face. Complex routing logic that once required extensive JavaScript development can now be expressed declaratively. Integration with external rule engines and services becomes straightforward. Most importantly, subject matter experts and business analysts can participate directly in defining and maintaining business rules, reducing the gap between business requirements and technical implementation.
With the new master project Imixs-Data, we are extending the technology stack of the Imixs Workflow Engine with a powerful new feature block. Imixs-Data provides functionality to view, group, and manage business process data. In the near future, the existing modules Imixs-Archive-Importer, Imixs-Archive-Exporter and Imixs-Archive-Documents will be migrated into this new master project.
Why a New Module?
The main motivation behind Imixs-Data is to separate the management of internal and external business data into a clean and reusable library. Especially with regard to the new AI functions of Imixs-Workflow, data and its clear grouping by business processes are becoming increasingly important.
Business data can either be generated directly by the Imixs Workflow Engine or provided by external data sources. Such data is typically required to run business processes efficiently and to provide users with relevant information.
Imixs-Data introduces four core capabilities:
Data Views – Display business data in a table or export it into a spreadsheet
Data Groups – Organize processes into main and sub-processes
Data Import – Import data from external sources (e.g. email, CSV, APIs)
Data Export – Export business data and documents into external storage
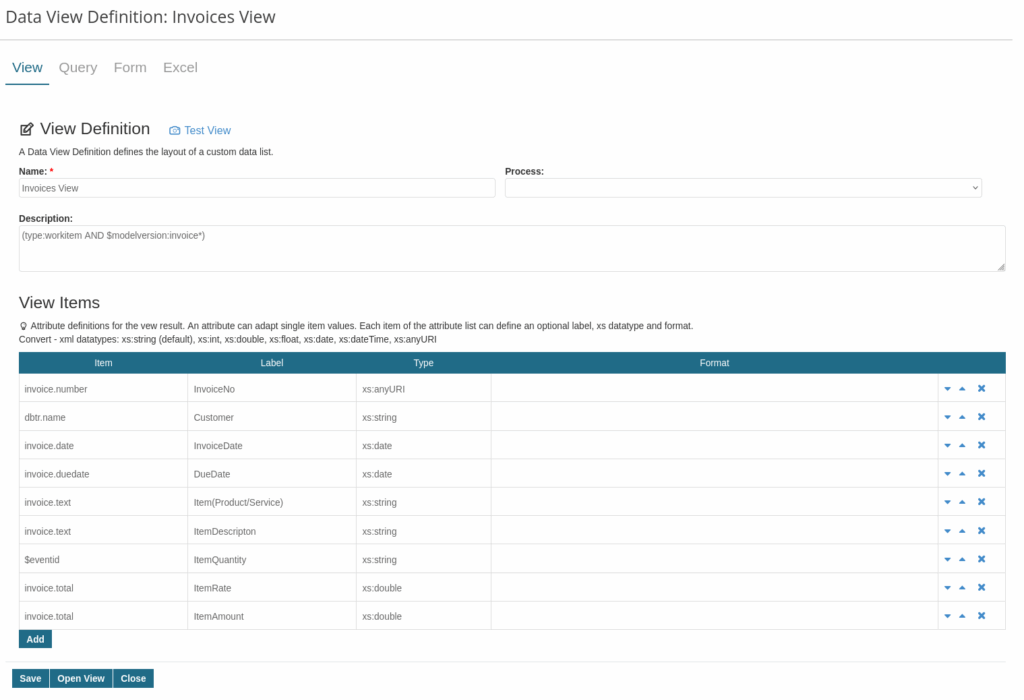
Data Views
Data Views provide a convenient way to select work items via queries and display the results in a list. A data view defines both the selector (e.g. a Lucene query or a reference to an internal/external data source) and the columns with their content.
In addition, data views allow you to configure columns, labels, and sorting options. They can also include custom search forms and spreadsheet exports, enabling flexible integration of individual business views.
Data Groups
Data Groups are a new pattern for organizing and linking business processes. A Data Group is itself a process that can be referenced by other processes within the same instance.
For example, you might want to:
Consolidate all payment transactions of a customer into a single Statement of Account
Group all invoices that need to be exported into an external IT system within a dedicated Export Process
Referencing a Data Group is done via a single process property, making it easy to access them through the Imixs Workflow API. This offers a smart and elegant way to handle complex relationships between business processes.
Data Import
The Imixs-Data Importer module provides a generic service to import documents from various external sources into the Workflow Engine. Sources can include an FTP server, an IMAP mailbox, or other structured data feeds.
The importer is built on top of the Imixs Scheduler API, enabling scheduled imports. The scheduler publishes CDI events that can be processed by specific importer implementations. This design makes the Importer highly extensible and adaptable to custom requirements.
Currently supported sources include:
IMAP – Import emails via IMAP
FTP – Import files from an FTP server
CSV – Import CSV files from local or remote locations
Custom import agents can also be implemented to handle additional data types.
Imixs-Archive-Exporter
The Imixs-Archive-Exporter is a microservice that exports documents from an Imixs Workflow instance into external storage systems, such as a local file system or an FTP server.
The service is fully decoupled from the workflow engine and can run independently – for example, on separate hardware or within an external cluster.
The Exporter processes EventLog entries created by the Workflow Instance and stores related file attachments in the defined target system. This architecture provides a scalable and flexible approach to managing long-term document storage.
Learn more about the possibilities of the Imixs Data function as well as its use in Imixs-Office-Workflow!
In Part I. of this series, we explored how metrics can bridge the gap between dynamic business processes (BPM) and business intelligence (BI). Now, in Part II, we dive deeper into the practical implementation: How to implement a Metric service, how to select the right metrics, integrate them into your BI tools, and ensure they deliver actionable insights?
The Technical Stack
Our solution combines several powerful open source technologies, each chosen for its unique strengths in building a scalable and efficient Business Intelligence system.
Eclipse Microprofile Metrics: Serving as the application part translating business data into metrics. This framework allows you to implement metrics based on the widely used Prometheus metric format in an easy way.
Prometheus: As our time-series database, Prometheus excels at storing and querying large volumes of metric data in real-time, making it ideal for monitoring and analysis.
Grafana: For visualization, Grafana transforms raw data into intuitive dashboards, enabling teams to quickly interpret trends and make data-driven decisions.
In the following sections, we’ll dive deeper into how each piece of this stack works and how you can leverage it to build your own metrics-driven BI solution.
These components also seamlessly integrated into Imixs-Office-Workflow, an open source business process management platform.
While Imixs-Office-Workflow comes with PostgreSQL as its default database, you can easily configure it to work with Microsoft SQL Server. This guide walks you through the setup process when running Imixs-Office-Workflow on Wildfly.
The ‘Event-Driven Business Architecture’ is the idea of a software architecture that centers business applications on events and processes. In the following, I will explain its core concepts and describe how building business applications around events can enhance architectural flexibility.
What is an Event?
When we talk about ‘Event-Driven Business Architecture’, one of the first questions that naturally arises is: What exactly is an event? Let’s examine the characteristics of an event in detail.
First of all, an event is something that happens, either unexpectedly or as a planned occurrence. Events are omnipresent in our business world – from a new customer request to the sending of an invoice or the receipt of a payment. When these events occur regularly and follow a defined sequence, we speak of a process. For example, the three events mentioned could be part of an order process.
From a technical perspective, an event has several properties that describe its nature. The most fundamental property is the timestamp indicating when the event occurred. Another crucial property is the actor who initiated the event – this could be a customer submitting a new request, an employee creating an invoice, or a technical system such as a transport system’s control unit sending tracking information. And last but not least, we have the kind of the event which describes the business context it occurred in. This typically relates to what we call a ‘business process’ and defines the formal framework the event is bound to.